The Game is a Matter of Inches (Silly Statistics)
Former Oakland Raiders coach and broadcaster John Madden once said, “inch for inch, Flutie in his prime was the best QB of his generation.” While the exact citation for this utterance may be temporally lost to history, and Madden supposedly was referring to Doug’s CFL days AND we know John Madden is known to be given to hyperbole, it nonetheless got me thinking: was Madden correct? If measured “inch for inch,” would Doug Flutie stand above (statistically) his generational peers? Either way, it gives us a chance to engage in some silly statistics.
There are two small hurdles we have to clear before we reveal the statistical results: who is included in the term “generation” and do we include Flutie’s CFL stats? Checking with the good people at Merriam-Webster.com, we have two definitions applicable to our question:
1b. a group of individuals born and living contemporaneously
2. the average span of time between the birth of parents and that of their offspring
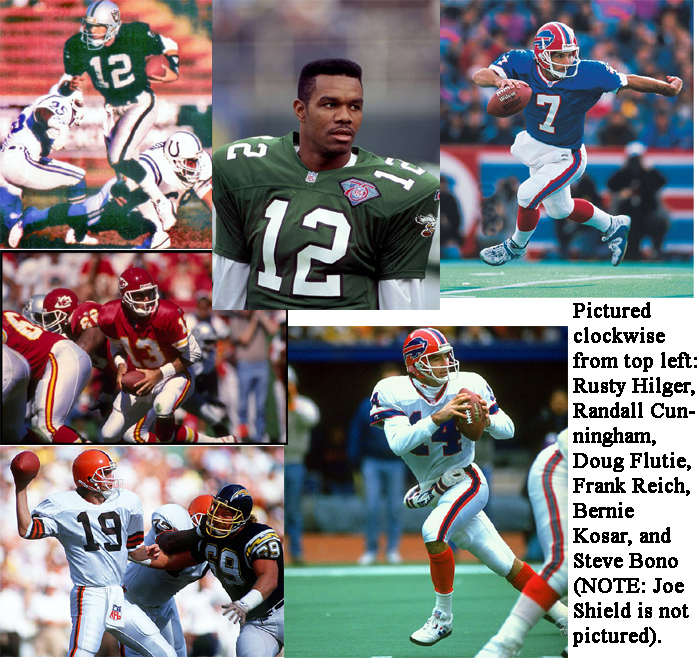
It would be pointless to use the second definition since we’d be including every great QB from various decades, and as much as I admire Doug, I know without looking at silly statistics that he was not better than Johnny Unitas, Joe Montana, etc. So, we’ll go with the 1b definition but narrow it even further to Doug’s draft class since we tend to compare the same positions within the same draft class quite often (in this case QBs). The table below lists Flutie’s draft class from NFL.com’s archive for 1985 with some choice player statistics.


*NOTE: Yellow highlight signifies leader in a particular column
Reading our chart above, we instantly see that Bernie Kosar provided the most “inches per year played” at 6.4” for those 1985 quarterbacks who played for more than five years. Doug is only fifth with 3.3” (though his relatively fewer inches are stretched across the most seasons). Mr. Kosar also gives us the most playoff wins (and least number of playoff losses) for his prototypical 6’4” stature (Doug had zero playoff wins).
However, it is actually Randall Cunningham (coincidentally the QB I grew up watching in the late 80s and early 90s) who “inch-for-inch” dominates in these select categories. Randall may give away one inch to Bernie, but Randall gave us four total Pro-Bowl appearances to Bernie’s one (tied with Doug and Steve Bono). Mr. Cunningham also leads by holding one 1st team all-pro (the rest had none).
Now, let’s get to the all-important question that is on every draft-day war room’s mind: “How many yards thrown will I be getting for every inch of QB I draft?” (because remember, every GM wants value on their money spent). The answer for 1985 is hands down Randall Cunningham at a stunning 394 yards thrown per inch. Doug comes in third here at only 210 yards thrown per inch. I know what you’re thinking – yards are nice, but what about TDs? Mr. Cunningham wins this competition too – at 2.7 TDs thrown per inch (unfortunately – because I’m a big fan – Dough is once again third with 1.2 TDs thrown per inch). For those of you hoping “number of games won per inch” might save Boston College’s favorite son, you’re out of luck there too. Randall gave us a little over one game won per inch followed by Bernie (0.68) and once again in third Doug at 0.54 games won per inch.
So as much as I love and respect Doug Flutie the football player for embodying the type of competitor spirit, football smarts, and desire to win any coach would kill for, unfortunately Mr. Madden is incorrect (silly statistically speaking) when he uttered “inch for inch, Doug Flutie is the best quarterback of his generation.” I think that’s something fans in Philly and Cleveland probably already knew – but my Flutie Flakes lovin’ heart just will never accept those silly statistics. Besides, we haven’t even mentioned the three CFL championships, the hail-mary, the drop-kick, the magic Buffalo season….


